Have you ever wondered how much that apartment in Providencia costs? Or how prices vary between Colonia Americana and Zapopan? To answer this, I needed data—lots of it. But getting clean, structured real estate data isn’t as simple as downloading a CSV. Here’s how I scraped, cleaned, and explored property listings from Inmuebles24, one of Mexico’s largest real estate platforms, inmuebles24.com.
In this post I’ll walk through my entire ETL pipeline, form bypassing Cloudflare checks to handling outliers and finally exploring the data; in other words I’ll go through the following steps[1]:
- Data collection
- Data cleaning
- Data transformation
- Data exploration
Data collection
Inmuebles24
Inmuebles24 is one of Mexico’s largest real estate platforms, listing thousands of properties for sale and rent across Guadalajara, Zapopan, and other major cities. Like many modern property sites, it relies on dynamic content loading (JavaScript) and anti-bot protections (Cloudflare) to prevent automated scraping—making data extraction a challenge.
Below is an example of a property in inmuebles24, highlighted are the parts of the html we are interested on.
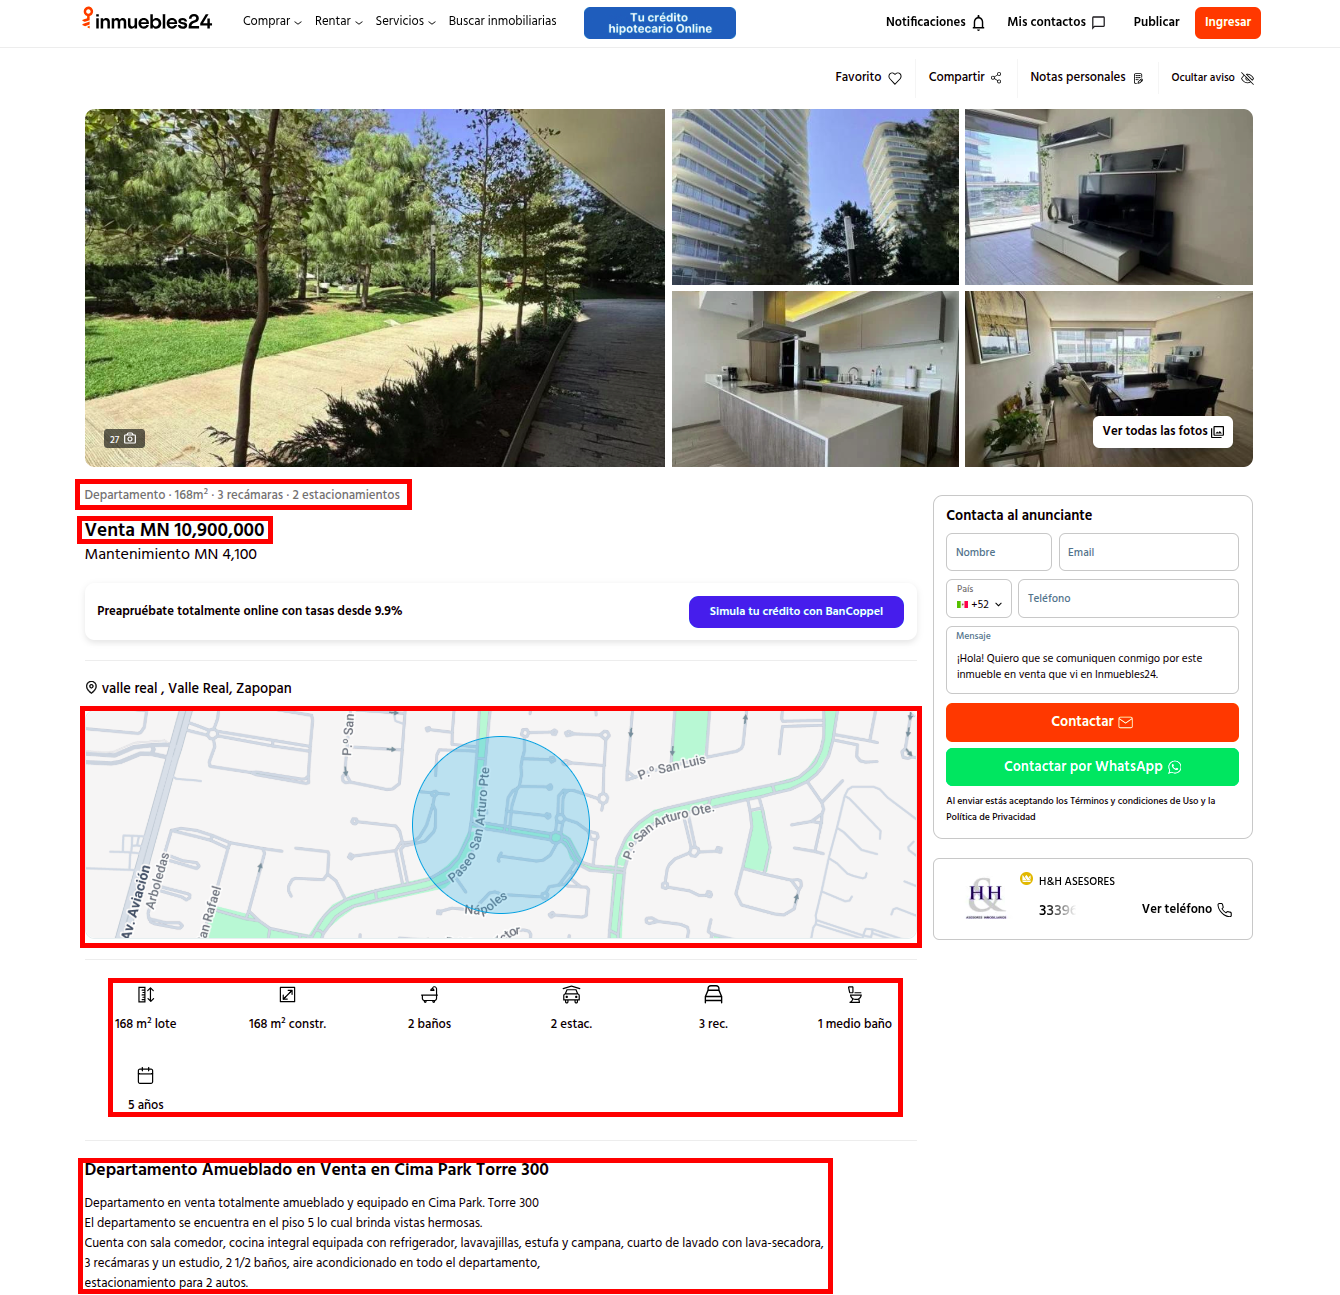
From top to bottom, this is what we get:
- Some key features of the property:
- Its type (appartment/house)
- Construction squared meters
- Number of rooms
- Number of parking spaces
- Sale price (MXN)
- Interactive map (powered by google maps). The coordinates are extracted from here!
- Features of the property: land and construction area, number of full and half bathrooms, number of rooms, age and parking spaces.
- Description of the property. This part was used to get other features like “pool” and “in gated community”.
Challenge: Cloudflare
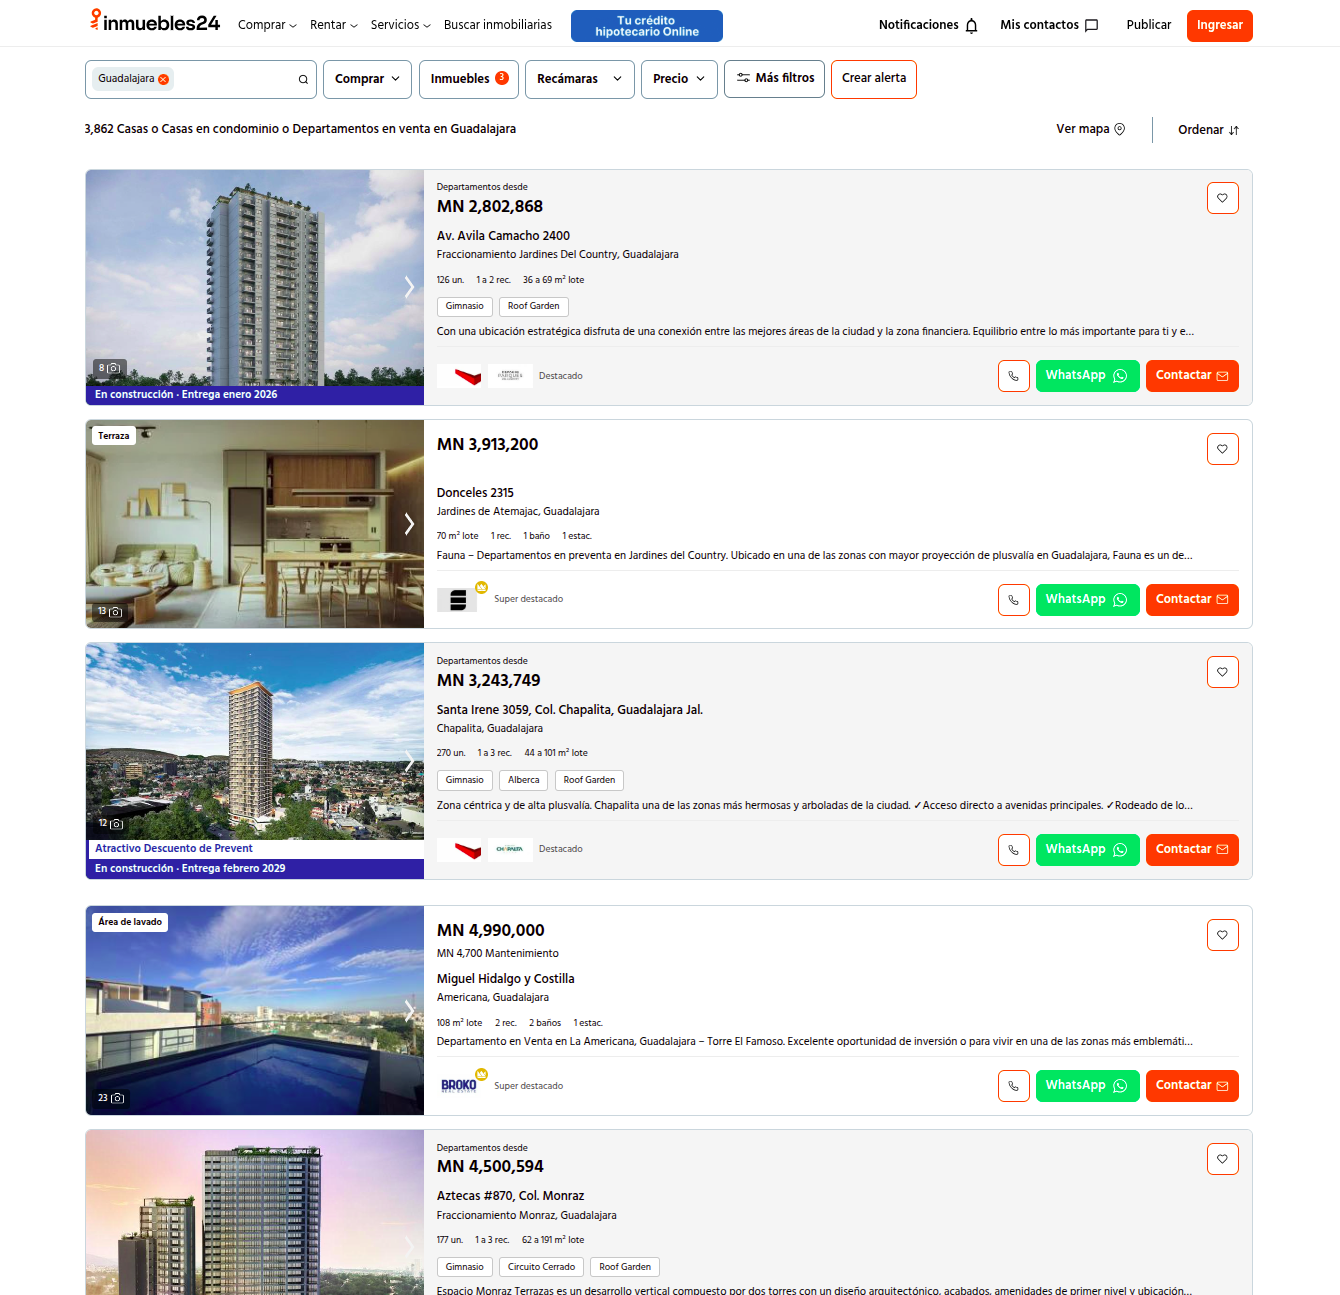
The first step was to get the links to the properties. Crawling through inmuebles24’s listings would be fairly easy since it follows the following pattern:
https://inmuebles24.com/{`types_of_properties`}-en-{`sale_or_rent`}-en-{`location`}-pagina-{`page_number`}.html
So the following url would be looking for “houses or appartments” in “sale” in “Guadalajara” in “page 2”.
https://www.inmuebles24.com/casas-o-departamentos-en-venta-en-guadalajara-pagina-2.html
To get the links we’d need to go over $n$ pages and get enough links to listings to then retrieve the data we need. To do this we could use libraries like Selenium and Sealth selenium plugins. Here’s a guide that documents that.
Even with Selenium’s stealth options (headless mode, user-agent rotation, and randomized delays), Cloudflare’s anti-bot system still detected automated traffic and triggered human verification.

Work around: Zenrows!
That’s where Zenrows came in—a web scraping API that bypasses Cloudflare by routing requests through real residential proxies and handling browser fingerprinting automatically. Unlike Selenium, which relies on simulating a browser, Zenrows masks the traffic as organic, allowing seamless access to Inmuebles24 without CAPTCHAs or blocks. Since it’s a lightweight HTTP-based solution (no heavy browser automation), it was also faster and more reliable for large-scale scraping.
This allowed me to get over 2500 links for each county (Guadalajra and Zapopan) from which I would later get the html and scrap the information I needed. Here’s the code that I used to get those links!
Web scrapping
Once having the links to the properties, extracting the htmls was straight forward, inmuebles24 doesn’t require a human verification when accesing directly to the listing url, so for this part, selenium was sufficient to get the html code for each property. The code used for this can be found here.
The second step was using the library BeautifulSoup4 to get the html elements that we need for our table. This step involved creating a bunch of functions to find and process the information in the html and store it in a tabular format that was then written to a SQLite database for later processing. If you’re interested on the code for that you can check out my github repo!
The output: raw (but structured) data
The final output holds these columns:
| Column | Data Type | Description |
|---|---|---|
| type | string | ‘Apartment’, ‘House’ or ‘House in gated community’ |
| construction | integer | Construction squared meters |
| bedrooms | float | Number of bedrooms |
| parking_spaces | float | Number of parking spaces |
| pool | booolean | If the property has a pool or not based on the property description |
| address | string | Address to the property |
| price | float | Price in mexican pesos (MXN) |
| link | string | Link to the listing |
| lat | float | Latitude |
| lon | float | Longitude |
| full_bathroom | float | Number of full bathrooms |
| half_bathroom | float | Number of half bathroom |
| property_age | string | If the property is “brand new”, “in construction” or the property age in years |
| land | float | Land squared meters |
| county | string | The county the property belongs to (Zapopan/Guadalajara) |
If you want to replicate the data collection for the same locations or any other available in inmuebles24, you can change a couple parameters in my code and you’re good to go!:
Data cleaning
Data preparation is the process of converting raw data into a set of features that can be used in a machine learning model. It aims to provide quality, integrity, and reliability of the data and address issues duch as missing values, noisy data outliers and data formats.[5]
To prepare the data, we have to do data cleaning (or cleansing), which involves correcting or removing incorrect, inaccurate, inconsistent, irrelevant or duplicate data from the dataset.
For the properties data this means removing those records that have missing or faulty information that will be needed in the machine learning model:
Missing values
- Remove records with no coordinates: this project is focused on evaluating how the location and the location of nearby points of interest affect the price of the property. This is the most crucial piece of information and therefore records without latitude and longitude have to be removed.
- The number of bedrooms is a good indicator of how big is the house and thus is significant for the model. So it was opted for removing those records as well.
- Price and construction area are used to create a new variable: price per m² which will be the target variable of the model. Therefore, we have to ensure that all the remaining records have both variables.
Duplicates
The properties data might contain duplicates for two reasons:
- The same url appeared in different pages and the same html was processed twice
- A property was listed more than once in different instances, this means that they would have a different id (therefore multiple url’s)
- To handle both of these cases, for the records having the same coordinates and price, only one instance was kept.
Inaccurate or useless data
Having more than 10 parking spaces, 40 full bathrooms, 20 half bathrooms or 100 bedrooms might be possible for some gigantic mansions in Guadlajara/Zapopan, that would still be an outlier though.
- Only those records with <= 10 parking spaces, full and half bathrooms and bedrooms were kept. We will still have pretty big properties in the model but not outliers.
The property age column can have three different cases: the age of the property (in years) and the strings “brand new” and “in construction”.
- Remove “in construction” properties and replace the “brand new” string with 0 years.
Finally, we are only interested on properties inside of Guadalajara and Zapopan. We can use the coordinates and a map of the two municipalities (shape file) to exclude any property outside of it. This filter out all those properties that were incorrectly classified to either of these locations and also eliminate properties a little out of bounds where we won’t have venues information.
- Remove records where the coordinates are out of Guadalajara and Zapopan boundaries.

Outliers
This section focuses on the price, construction and land variables. To identify the outliers and remove them, the 3 following methods were used:
Domain based
Same as before, knowing the domain we can filter out data that doesn’t make sense or that is clearly an outlier for the variables mentioned before. For Zapopan and Guadalajara’s market the following thresholds were set:
- The selling price of the property must be between the 100k to 100M ($ MXN) range
- The construction area between the 10m² to 1,200m² range
- The land area between the 10m² to 1,500m² range
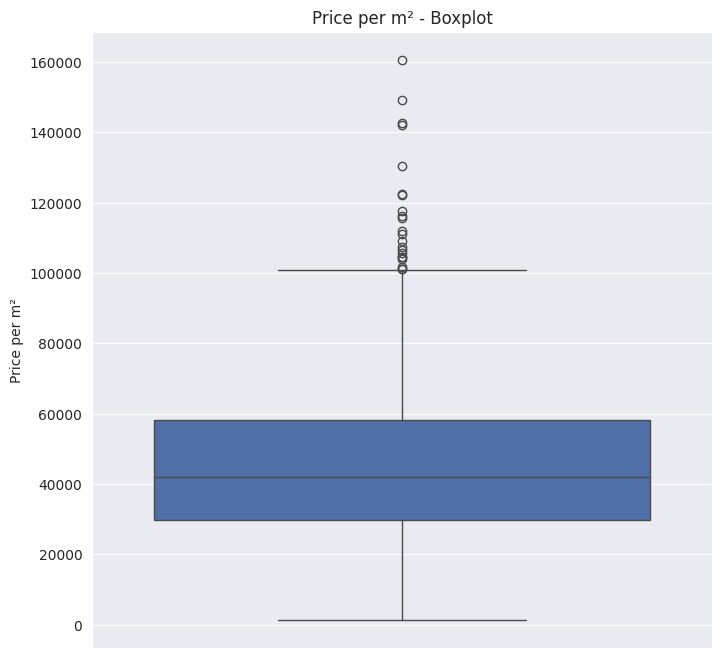
Interquertile Range (IQR)
The IQR or box plot method is pretty straight forward. The IQR is calculated through the difference of the third and first quartile ($IQR = Q3 - Q1$). Any object that is more than $1.5 \times IQR$ smaller than $Q1$ or $1.5 \times IQR$ larger than $Q3$, is treated as an outlier because the region between these boundaries contains 99.3% of the objects.
The graph below shows the boxplot of the variable Price per construction squared meter. The whiskers (in this case only the top one), shows the $1.5 \times IQR$ boundaries from $Q1$ and $Q3$. The points outside of these boundaries are the outliers.
Modified Z-Score
The Modified Z-Score takes aspects of Z-Score and IQR to create a more robust version of the Z-Score method.
Comparing it to the Z-Score method, the Modified Z-Score uses the median instead of using the mean as a reference point. It also uses the Median Absolute Deviation (MAD) instead of the standard deviation ($\sigma$).
The Modified Z-Score formula looks like this:
$$Z_{mod} = 0.6745 \times \frac{x_i - {median}}{MAD}$$
Where:
- 0.6745 is a constant used to approximate the median-equivalent of standard deviation
- $x_i$ is the current data point
- $median$ is the median of the dataset
- $MAD$ is the Mean Absolute Deviation, given by $median(|{x_i - median}|)$
Typically, with Modified Z-Score, values with a score of $> 3.5$ or $< -3.5$ are considered outliers.
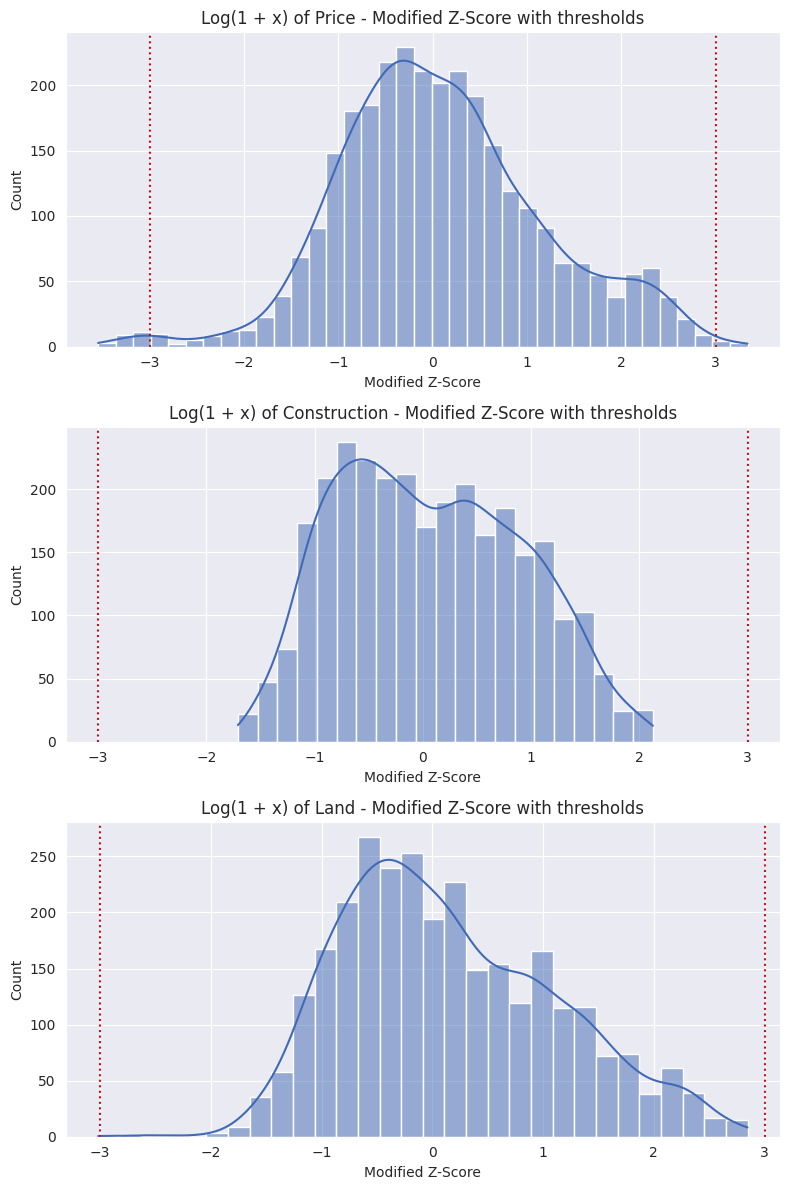
Since, by nature, our data is right skewed for the price, construction and land variables, a $log(1+x)$ is performed before applying this method to normalize the data. [5] Afterwards the Z-Score is calculated for each variable.
In the graph below, we can see the Modified Z-Score graphs for each variable. The red lines indicate the thresholds, the data outside of the thresholds are considered outliers and are removed.
Data cleaning summary
Below is a table with all the cleansing that was performed, showing how many records were removed for each step and how many records are remaining.
| Criteria | Removed Records | Remaining |
|---|---|---|
| Raw data | 0 | 5,031 |
| Missing coordinates | -1,011 | 4,020 |
| Missing number of bedrooms | -92 | 3,928 |
| No price or construction information | -0 | 3,928 |
| Duplicated postings | -160 | 3,768 |
| Over 10 bedrooms | -19 | 3,749 |
| Over 10 parking spaces | -13 | 3,736 |
| Over 10 half bathroom | -1 | 3,735 |
| Over 10 full bathroom | -0 | 3,735 |
| Properties “in construction” | -199 | 3,536 |
| Out of nieghborhood boundaries | -187 | 3,349 |
| 100k $\le$ price $\ge$ 100M ($ MXN) | -10 | 3,339 |
| 10m² $\le$ construction $\ge$ 1,200m² | -33 | 3,306 |
| 10m² $\le$ land $\ge$ 1,500m² | -331 | 2,975 |
| Interquartile Range Method | -22 | 2,953 |
| Modified Z-Score Method | -26 | 2,927 |
Data transformation
Encoding categorical variables
Machine learning models generally require numerical input, necessitating the conversion of categorical features into a numerical format. There are several approaches depending on the type of data (ordinal encoding, one-hot encoding, hash encoding, etc.). [5]
The categorical variables in the properties table will use one-hot encoding as they are boolean (yes/no values) or non-hierarchical.
poolis the only yes/no categorical variable we have, it is encoded as an integer column (1 for yes and 0 for no)
Feature engineering
Feature engineering is using domain knowledge to create new features or combine existing featrues to enhance the predictive power of the model. [5]
As mentioned earlier, the price_per_m² column — representing the price per
square meter of construction — was created as the target variable. This
transformation normalizes the data by accounting for differences in construction
size, allowing for a more consistent comparison across properties.
The gated_community variable was created to indicate whether a property is
located within a gated community (1) or not (0). This information was derived
from the type column, which originally distinguished between apartments,
houses, and houses in gated communities.
After extracting the gated community information, the type column was remapped
to retain only two categories: ‘apartment’ and ‘house’.
Additionally, one-hot encoding was applied to the updated type column,
resulting in the creation of the type_apartment and type_house variables to
represent the property type in binary format.This transformation allows the model
to interpret categorical information numerically without assuming any ordinal
relationship between the categories, improving its ability to learn meaningful
patterns.
Data exploration
Raw property data is just numbers and coordinates—until you ask the right questions. In this section, we’ll transform our cleaned dataset into actionable insights about Guadalajara and Zapopan’s real estate market. Through visualizations and statistical summaries, we’ll uncover:
- The most expensive neighborhoods
- Pools and price
- Differences between Guadalajara and Zapopan
- And more…
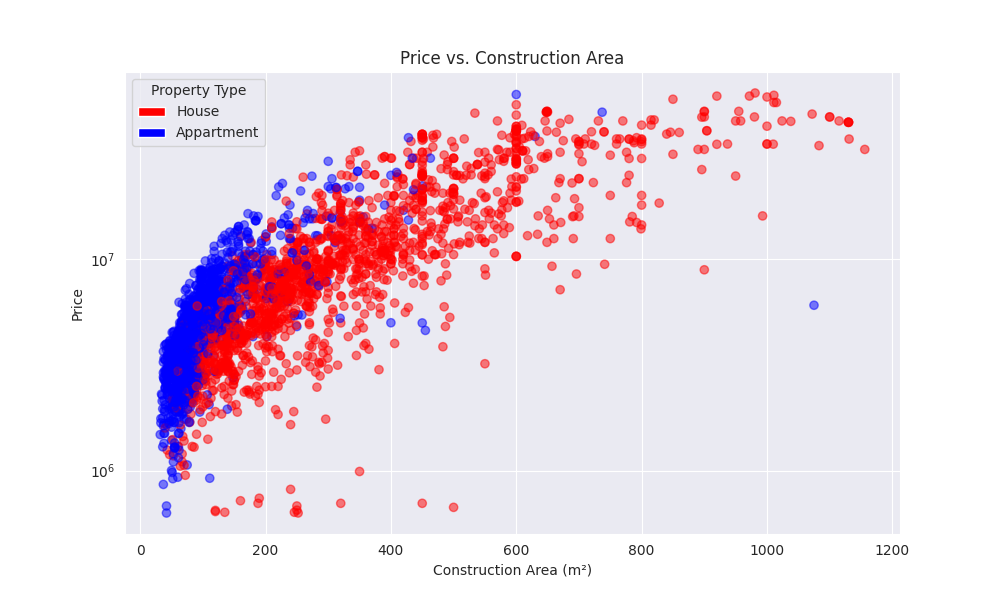
Price vs construction area
This relationship is pretty obvious, the bigger the house, the more it will cost. However, it is good to start with this relationship to notice that the increase isn’t proportional.
Also, the points are colored by tye (appartment/house). We can notice that the appartments tend to be smaller and cheaper (with a few anomalies).
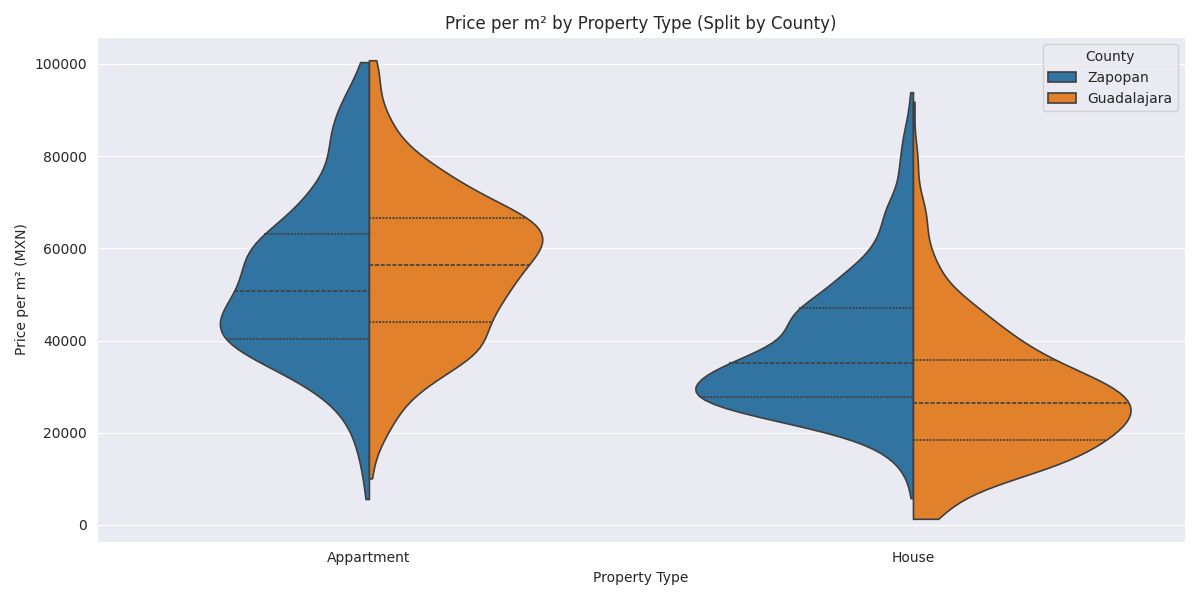
Price per m² by County
What’s more expensive: Zapopan or Guadalajara? Turns out that the price per squared meter in Guadalajara is slightly cheaper when it comes to houses but pretty similar for appartments.
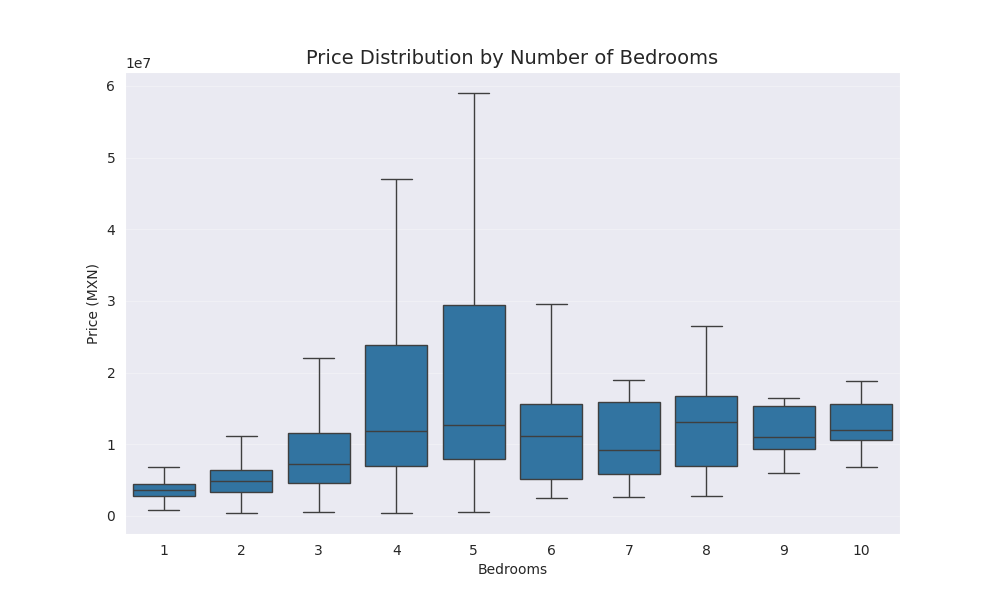
Property characteristics
The graph below, shows the price distribution depending on the number of bedrooms in the property.
- We can see a trend upwards (in the median) going from 1 to 5 bedrooms.
- From 6 to 10 rooms there isn’t a clear trend on the sales price.
- The sales price for properties with 4 and 5 bedrooms has a lot of variation. We can see from the boxplots that the price range is really wide for those.
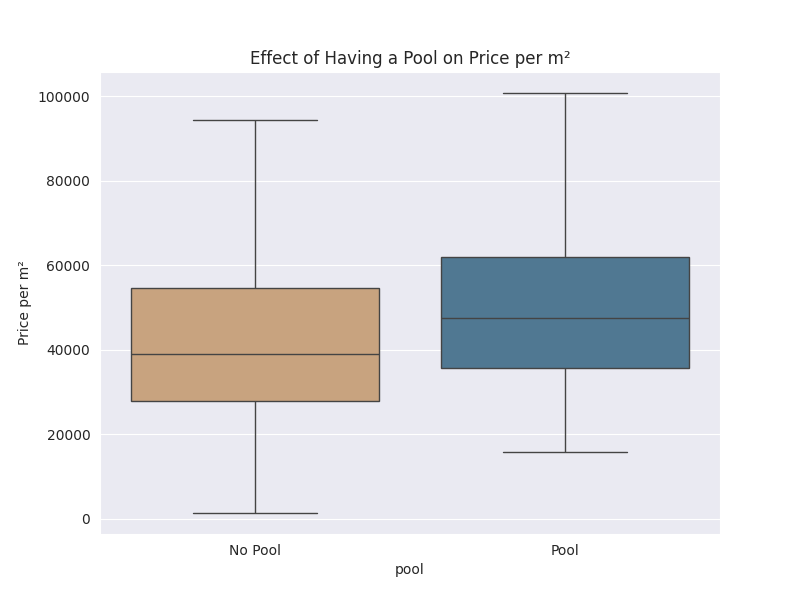
Properties with a pool on their building (appartments) or in the house appear to have a slight increase in the price from the boxplot below.
Relationship between variables
The best way to see the relationship between the variables is to use a correlation heatmap:
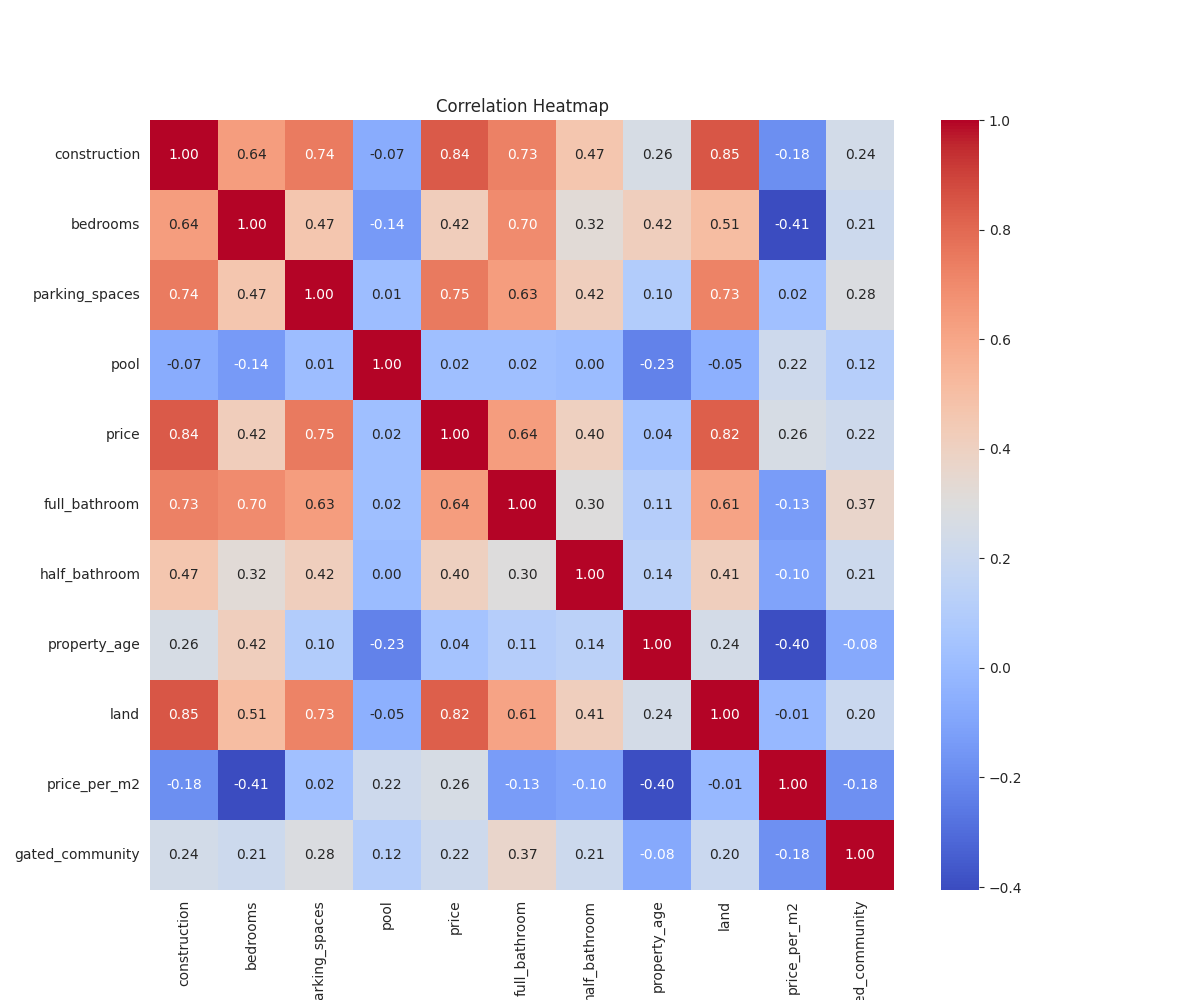
From the figure above, we can get the following insights:
Strong correlations
| Feature Pair | Corr | Interpretation |
|---|---|---|
construction – price | 0.84 | Bigger homes → higher price (intuitive) |
land – price | 0.82 | Larger land → higher price |
construction – land | 0.85 | Bigger buildings tend to be on larger plots |
construction – parking_spaces | 0.74 | Larger homes → more parking |
full_bathroom – bedrooms | 0.70 | More bedrooms → more full bathrooms |
Moderate correlations
| Feature Pair | Corr | Interpretation |
|---|---|---|
price – parking_spaces | 0.75 | More parking adds value |
construction – full_bathroom | 0.73 | Bigger homes → more bathrooms |
price – full_bathroom | 0.64 | Bathrooms → add value, but less than construction or land |
construction – bedrooms | 0.64 | Bigger homes → more bedrooms |
bedrooms – land | 0.51 | More bedrooms likely on bigger lots |
Weak or negative correlations with price per m²
| Feature | Corr | Interpretation |
|---|---|---|
construction | -0.18 | Larger homes often lower per m² (economies of scale) |
bedrooms | -0.41 | More bedrooms = bigger home, but price doesn’t increase proportionally |
property_age | -0.40 | Older homes tend to be cheaper per m² |
full_bathroom | -0.13 | Slightly less valued in price per m² |
land | -0.01 | Virtually no effect per m² (used for other purposes?) |
gated_community | -0.18 | Possibly location-specific; may not raise price per m² on average |
Another interesting finding is that pool appears to have no significant
correlation with any other variable, which may suggest that it isn’t
consistently valued across areas.
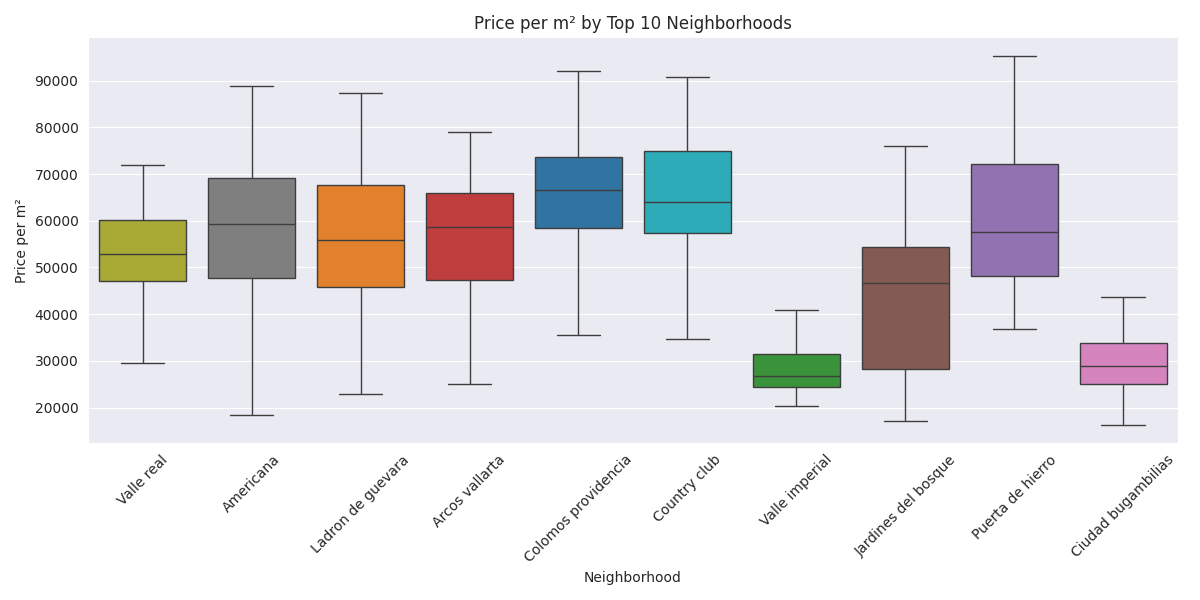
Prices in the top 10 most offered neighborhoods
How’s the price distribution across neighborhoods? Below we have the top 10 neighborhoods across Guadalajara and Zapopan with the most properties on sale and their distribution.
We can see that the boxplots of neighborhoods such as ‘Colomos providencia’, ‘Country club’ and ‘Puerta de hierro’, which are known for their exclusivity, raise above the others, showing that the price per m² is higher.
On the other side, we see that ‘Valle Imperial’, and ‘Ciudad Bugambilias’ tend to be lower than the others, this could be because both neighborhoods are in the outskirts of the city.
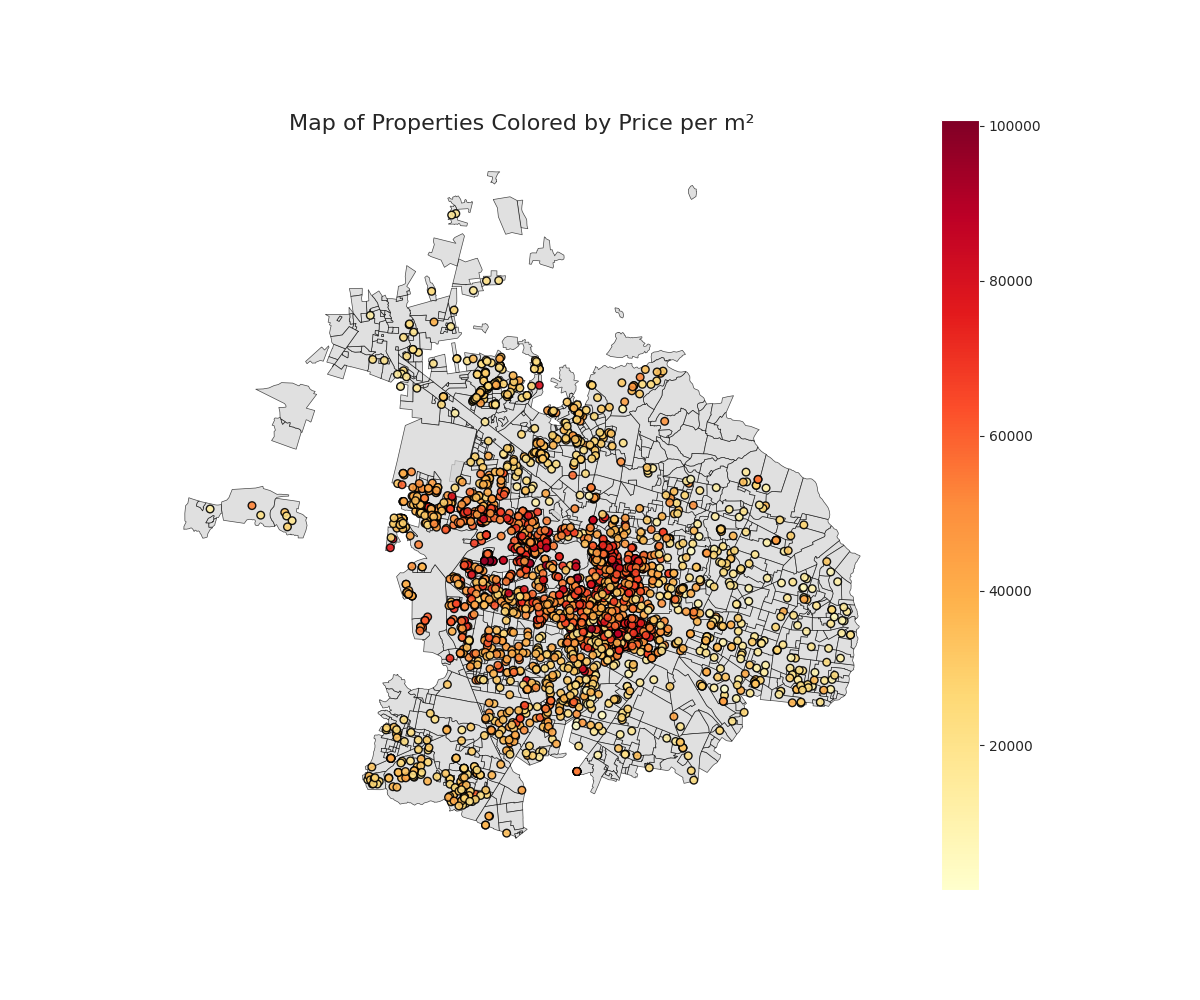
Price on the map
Lastly, we can see a heatmap of the properties in Zapopan and Guadalajara colored by their price per m². We can see that the most expensive properties tend to be in the left-most center of the city, in Zapopan.
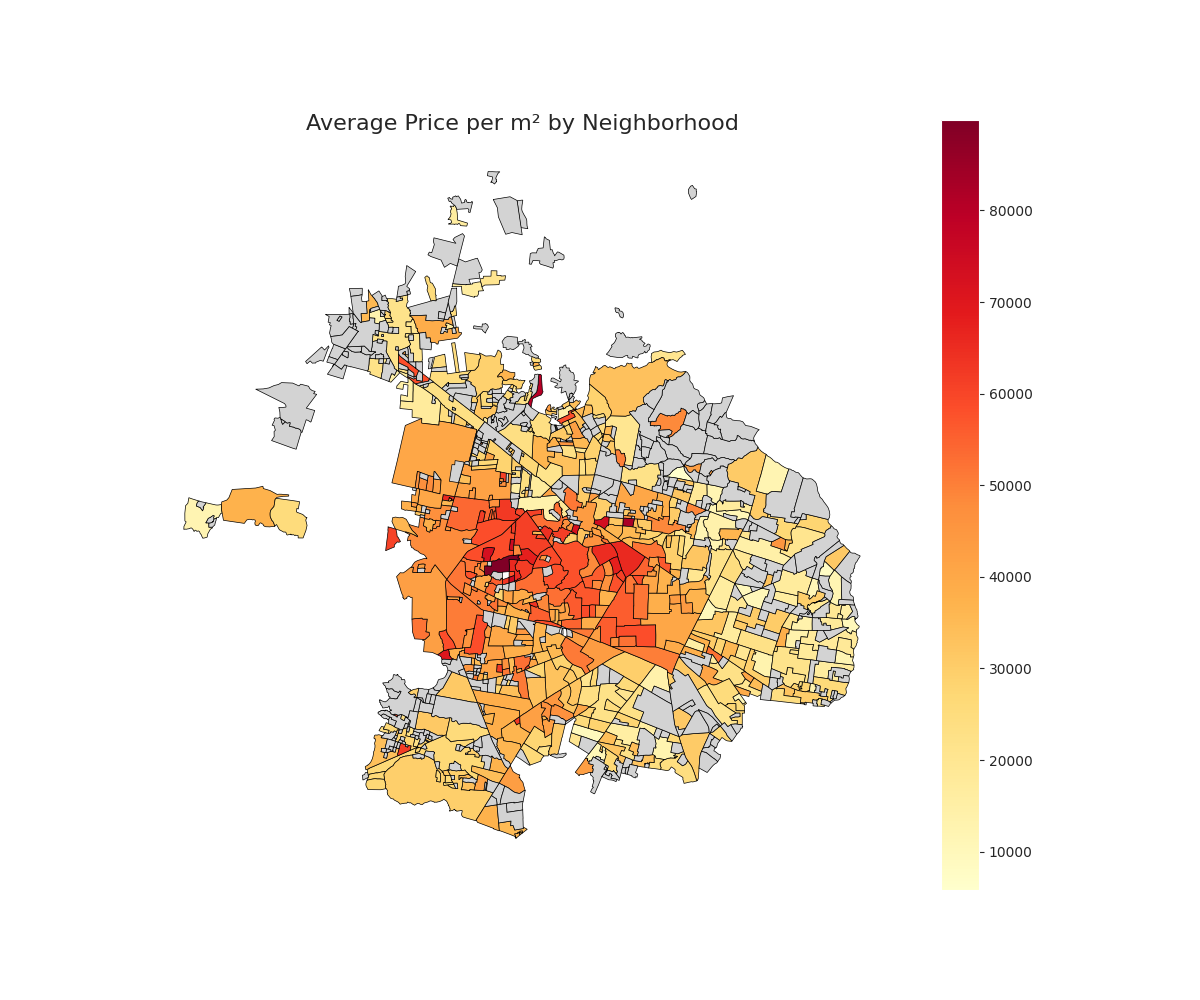
Looking at a clearer picture, using the neighborhood average price to color the areas, we see that, indeed, the center of Zapopan is the most expenisve zone in the metropolitan area and that the outskirts tend to be lower in price.
Interactive map
References
[1] Noring, C., Jain, A., Fernandez, M., Mutlu, A., & Jaokar, A. (2024). Prompt strategy. In AI-assisted programming for web and machine learning (Chap. X). Packt Publishing.
[2] Verdhan, V. (2025). Introduction to machine learning. In Data without labels (Chap. 1). Manning Publications.
[3] Pelletier, H. (2024). 3 Simple Statistical Methods for Outlier Detection. Towards Data Science. https://towardsdatascience.com
[4] Lang, E. (2024). Anomaly detection on nonnormalized data. In Statistical Tableau (Chap. 7). O’Reilly Media, Inc.
[5] Yehoshua, R. (2025). Introduction to Scikit-Learn. In Machine learning foundations, Volume 1: Supervised learning (Chap. 3). Addison-Wesley Professional.
[6] Han, J., Kamber, M., & Pei, J. (2011). Outlier detection. In Data mining: Concepts and techniques (3rd ed., Chap. 12). Morgan Kaufmann.