What do 7-Eleven, bus stops, and parks have in common? They might secretly shape your home’s value. In this post, I’ll share how I built a dataset of urban venues across Guadalajara and Zapopan—from creating precision grids to wrestling with API rate limits—all to answer one question: How does proximity to amenities affect property prices?
Proximity to amenities like parks, metro stations, or shopping centers can significantly impact property prices. Studies show:
- Positive Influence: Homes near green spaces (parks) command premiums of 5–10%[2], while access to public transit (e.g., metro stations) boosts values by 8–20% 19[1].
- Negative Influence: Properties near landfills or highways may see price reductions of 6–15%[1].
- Mixed Effects: Certain type of restaurants and bars can increase prices in affluent areas but deter families in suburban zones.
In Guadalajara and Zapopan, where urban expansion intersects with lifestyle preferences (e.g., tech hubs vs. historic centers), quantifying these effects requires granular venue data. This post explores how I extracted, cleaned, and mapped venue data using OpenStreetMap (OSM), Foursquare, and Google Maps to build a geospatial pricing model.
Geospatial APIs
OpenStreetMap (OSM)
OpenStreetMap (OSM) is a free, open map database updated and maintained by the community via open collaboration. Contributors collect data from surveys, trace aerial photo imagery or satellite imagery, and import from other freely licensed geodata sources.
OSM is freely licensed and van be used by anyone. Its API doesn’t require authentication.
Advantages
- Free API / Unlimited calls and results per call
- Returns geometry (handy when getting parks)
- Gets data from official public sources
Disadvantages
- API is harder to use
- Data for specific types of venues might be incomplete or inaccurate
Foursquare
Foursquare’s proprietary API focuses on trendy, commercial venues (e.g., bars, coworking spaces), leveraging user check-ins and business partnerships for rich metadata like ratings and photos. Foursquare is really good for commercial venues but it might be inaccurate for other type of venues such as public transporation, parks, police stations, etc.
The API has a free tier that has a limited number of calls and each call can only return a max numbre of results. You have to create an account to get an API Key.
Advantages
- Accurate data for commercial venues
- Price (free tier)
- Easy to use
Disadvantages
- Not accurate for certain type of venues (specially non-commercial)
- Limit of 50 results per call, which is a downside when exploring large areas
- Venue categorization (requires a lot of post-work)
Google Maps
Google’s proprietary Places API offers highly accurate, polished Point of Interest (POI) data sourced from satellite imagery, Street View, and business listings. It excels in global coverage and features like autocomplete, reviews, and photos, but its pricing can be prohibitive post-free tier. The API’s strength lies in enterprise-grade reliability; ideal for real estate or logistics. Best for applications needing comprehensive, up-to-date data with minimal preprocessing.
Despite being the most complete API, it is also the most expensive. It also has a result limit of 20 venues per query and it also needs sleep time between queries, which makes it a really slow way to get venue information. To use it you need to create a Google Cloud account and register a credit card. It has $200 each month to use but exceeding that cap will be pricy. For more information on price here’s Google Maps Platform site.
Advantages
- Most up-to-date data
- Coverage
- Venue categorization
- Most popular/used
Disadvantages
- Price (~10k free requests per month)
- Really slow (20 results/query and requires sleep time)
Getting the data
Based on the restrictions mentioned before, we cannot query all the venues over an area like Guadalajara + Zapopan in a single request since we would get a limited number of results and our data would be inaccurate. To be able to run the query we need to split the map into smaller parts and run the APIs over each of those parts.
Grid creation: overcoming API limits
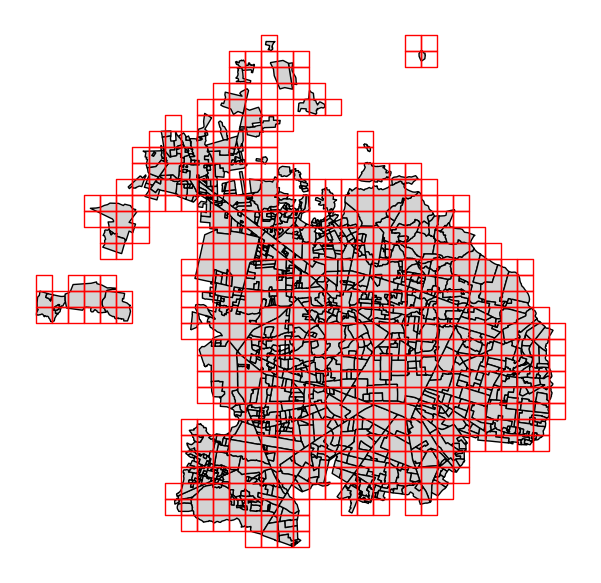
To efficiently gather venue data cross Guadalajara and Zapopan while considering the API result limits, I implementd a 1km $\times$ 1km grid system over the metropolitan area (figure below). This method ensured complete coverage while optimizing API calls.
Why a grid system?
- Precision: smaller grids provide more granular data than city-wide queries
- Efficiency: stays within API rate limits (Foursquare and Google) and allow parallel extraction (OSM)
- Scalability: easy to adjust grid size based on API restrictions.
Using the APIs
Each API has its own structure and limitations, but in general, they all operate by receiving a point on the map and returning venues of a given type within a specified radius $r$.
To maximize data quality and completeness, I leveraged the strengths of each API:
- Foursquare was used primarily to retrieve commercial venues such as convenience stores, gyms, and shops.
- OpenStreetMap (OSM) provided public infrastructure data, including parks, public transportation stops, and hospitals.
- Google Maps was only used for schools, as the provided categorization is better; as well as a complementary source, specifically in areas where Foursquare or OSM data appeared incomplete or inconsistent.
The table below shows a complete table of the extracted information. The categories are reviewed in more detail in the Data cleaning and categorization section.
| Category | API | Description |
|---|---|---|
| green spaces | OSM | Parks, forests, woods. |
| public transportation | OSM | Bus stops, light rail stations, sharing bicycle system |
| police stations | OSM | Listed police stations in the area |
| hospitals | OSM | Public and private hospitals |
| malls | OSM | Shopping centers containing lots of stores and restaurants, usually with space outside for parking |
| retail | Foursquare | Includes convenience stores, clothing stores, malls, pharmacies, mini-markets, etc. |
| health | Foursquare | Public and private hospitals, clinics, medical specialistst, pharmacies, etc. |
| sport | Foursquare | Gyms, clubs and studios (yoga, barre, pilates, cycling, cross-fit etc.) |
| education | Google Maps | Kindergarde, Elementary, Middle, Highschool and College (separate query for each) |
This multi-source strategy allowed me to balance completeness and accuracy, while also reducing over-reliance on any single API.
I iterated over each 1 km × 1 km grid cell, calling the APIs to return the venues for the given category within each grid, adding sleep time and handling each specific limit. This ensured redundancy and complete coverage over the area.
Results
Foursquare and Google Maps
Foursquare and Google Maps return the query results in JSON format. What we do
from this is to pick only the fields we are interested on and store them in a
pandas DataFrame (python’s way to store tabular data) for
each category and export each to a comma separated value file (csv); each of
these csv files will later be used for data cleaning and processing.
The relevant fields that we are keeping from the whole JSON result are:
- name: name of the venue
- category: Foursquare or Google Maps given category
- category_code: code of the category (Foursquare only)
- lat: latitude
- lon: longitude
- address: address in text format
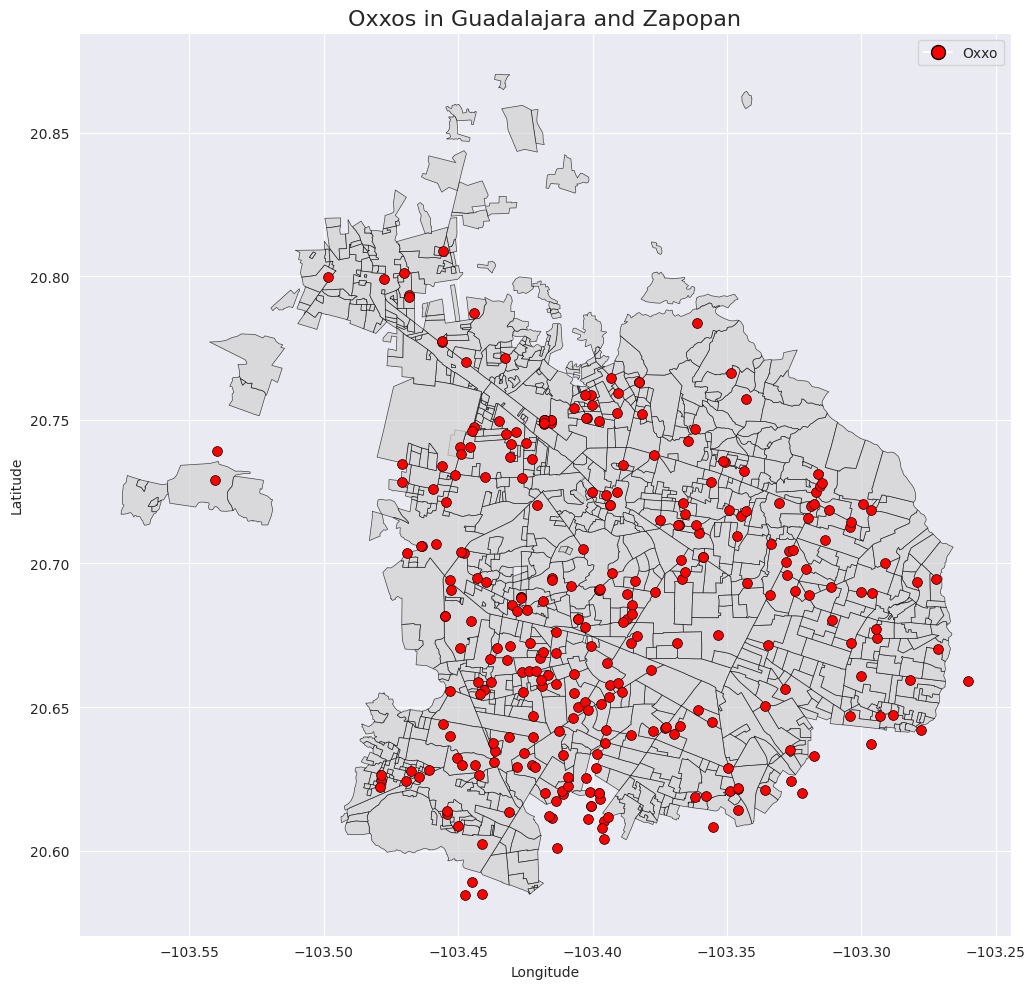
As an example of the data we are retrieving, below is an image of all the OXXOs (a popular 7-Eleven-like convenience store in Mexico) found through Foursquare’s API.
OSM
For OpenStreetMap, the data is returned in a different format: GeoDataFrames.
A GeoDataFrame (from the geopandas library) is a specialized data structure that extends pandas DataFrames with geographic capabilities, where the geometry column stores vector shapes (points, lines, or polygons). Unlike just getting the coordinates to a point in the map, the geometry column allows to store more complex shapes, like the whole area of a park, forest, college campus, etc.
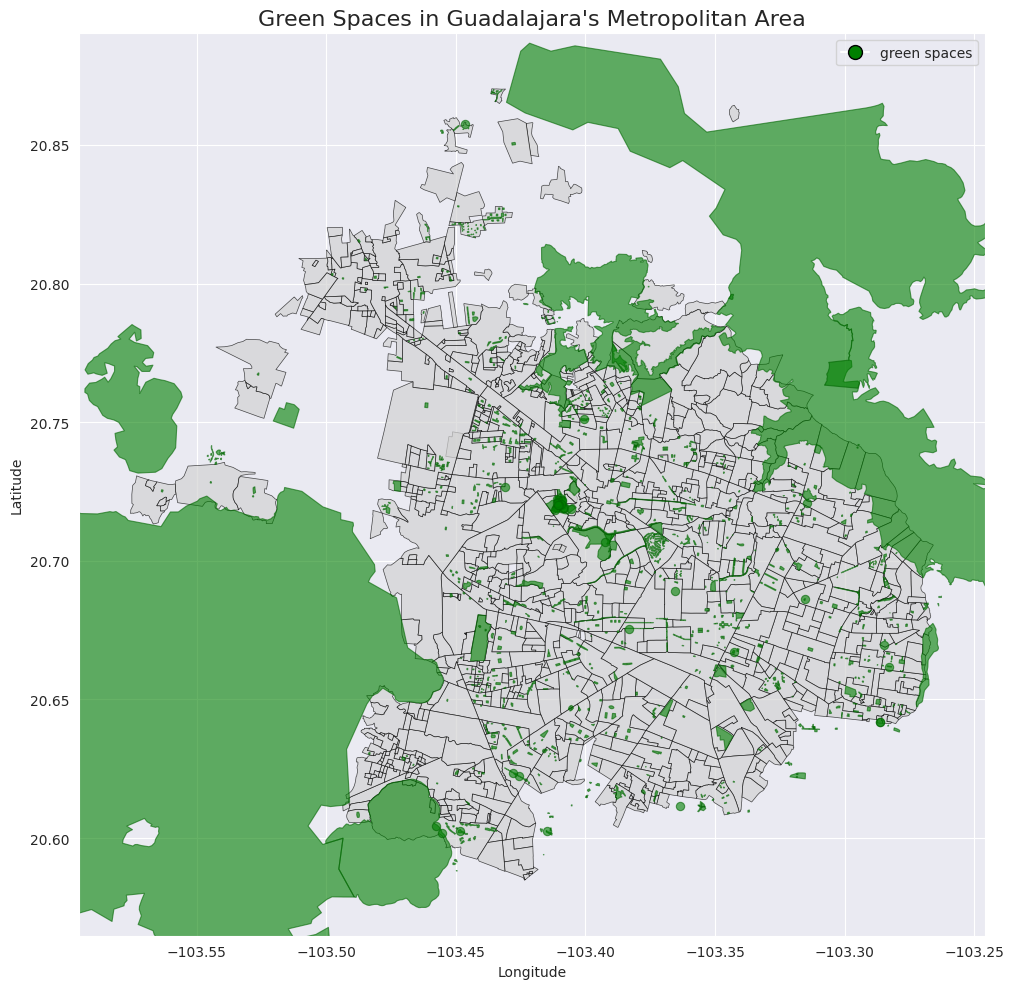
For this project, it was specially helpful for getting the ‘green spaces’ information, as this allows to calculate more accurately the distance between a property to the nearest part of a park or forest.
Below is a graph showing the ‘green spaces’ in Guadalajara and Zapopan to make the GeoDataFrame concept clearer.
Categorization and data cleaning
After getting the results from the APIs, there is still a lot of work to make the data usable for a machine learning model, specially when it comes to the venues categories.
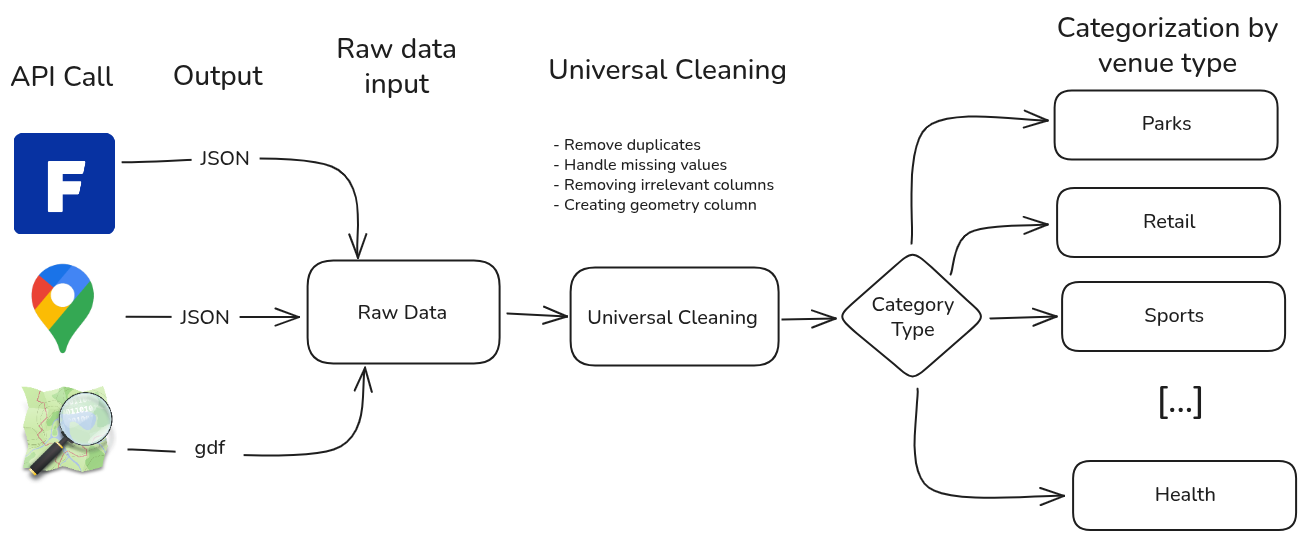
To clean and categorize the data, the process shown in the flowchart below was followed:
Standardizing the data
As mentioned before, both Foursquare and Google Maps return JSONs, so it is easy to dig through it and extract only the data that we need, leaving it in a nice tabular format.
However, OpenStreetMap, despite returning a tabular format directly (GeoDataFrame), will vary in the columns that it returns depending on the type of place we queried. The data that is useful to do the posterior categorization might be in a different column depending on the category. This posed a big, time-consuming challenge at the time of finding a way to categorize each OSM venue.
Universal cleaning
All of the venues, regardless of their category went through the same basic data cleaning process:
- Remove duplicates: to cover every squared meter, the APIs were given a radius big enough to cover all the grid space for each grid, this generated redundancy and allowed a venue to be returned more than once. Also, when the same venue came from different APIs, only one copy was kept.
- Handling missing values: venues without coordinates or without enough information to be categorized were removed from the data.
- Removing irrelevant columns: in OpenStreetMap, where the API might return a lot of different columns depending on the venue type, some columns were composed mostly of missing values; these columns were eliminated as they wouldn’t help with the categorization.
- Creating geometry column: while OpenStreetMap results already have a geometry column, one had to be created for Foursquare and Google Maps results based on the latitude and longitude returned.
Categorization by venue type
Once the data is nice and clean; new category and subcategory variables were
created for each venue based on the remaining columns after the universal
cleaning.
The idea is to have a more granular subcategory column and try both in the
model to see which is more significant in the model. An example of the difference
between category and subcategory would be hospital and public hospital
(respectively) for a health venue. This would allow us to identify if there is
a real difference between the nearby hospital being private or public in the
property selling price.
The categorization was distinct for every venue type, as different challenges were specific to each one. For example, among other problems, the categorization provided by the API might:
- be too specific or too wide,
- have some obvious mistakes that needed to be fixed,
- show several geometries for a single venue (non-duplicates but pointing to the same place),
To get around this, domain knowledge and investigation in official sources was needed.
Overcoming categorization: real cases
Below are some examples of for three categories, explaining how the challenges were handled.
Using official sources
The OSM API categorization for the public transport wasn’t accurate, it didn’t differentiate bus stop from a light rail train station; or the different types of bus networks in the city.
To get a good categorization for each of these points, the official Guadalajara’s Metropolitan Zone Public Transport site was used as reference. We used the map below to identify and categorize each stop to the right transportation system.
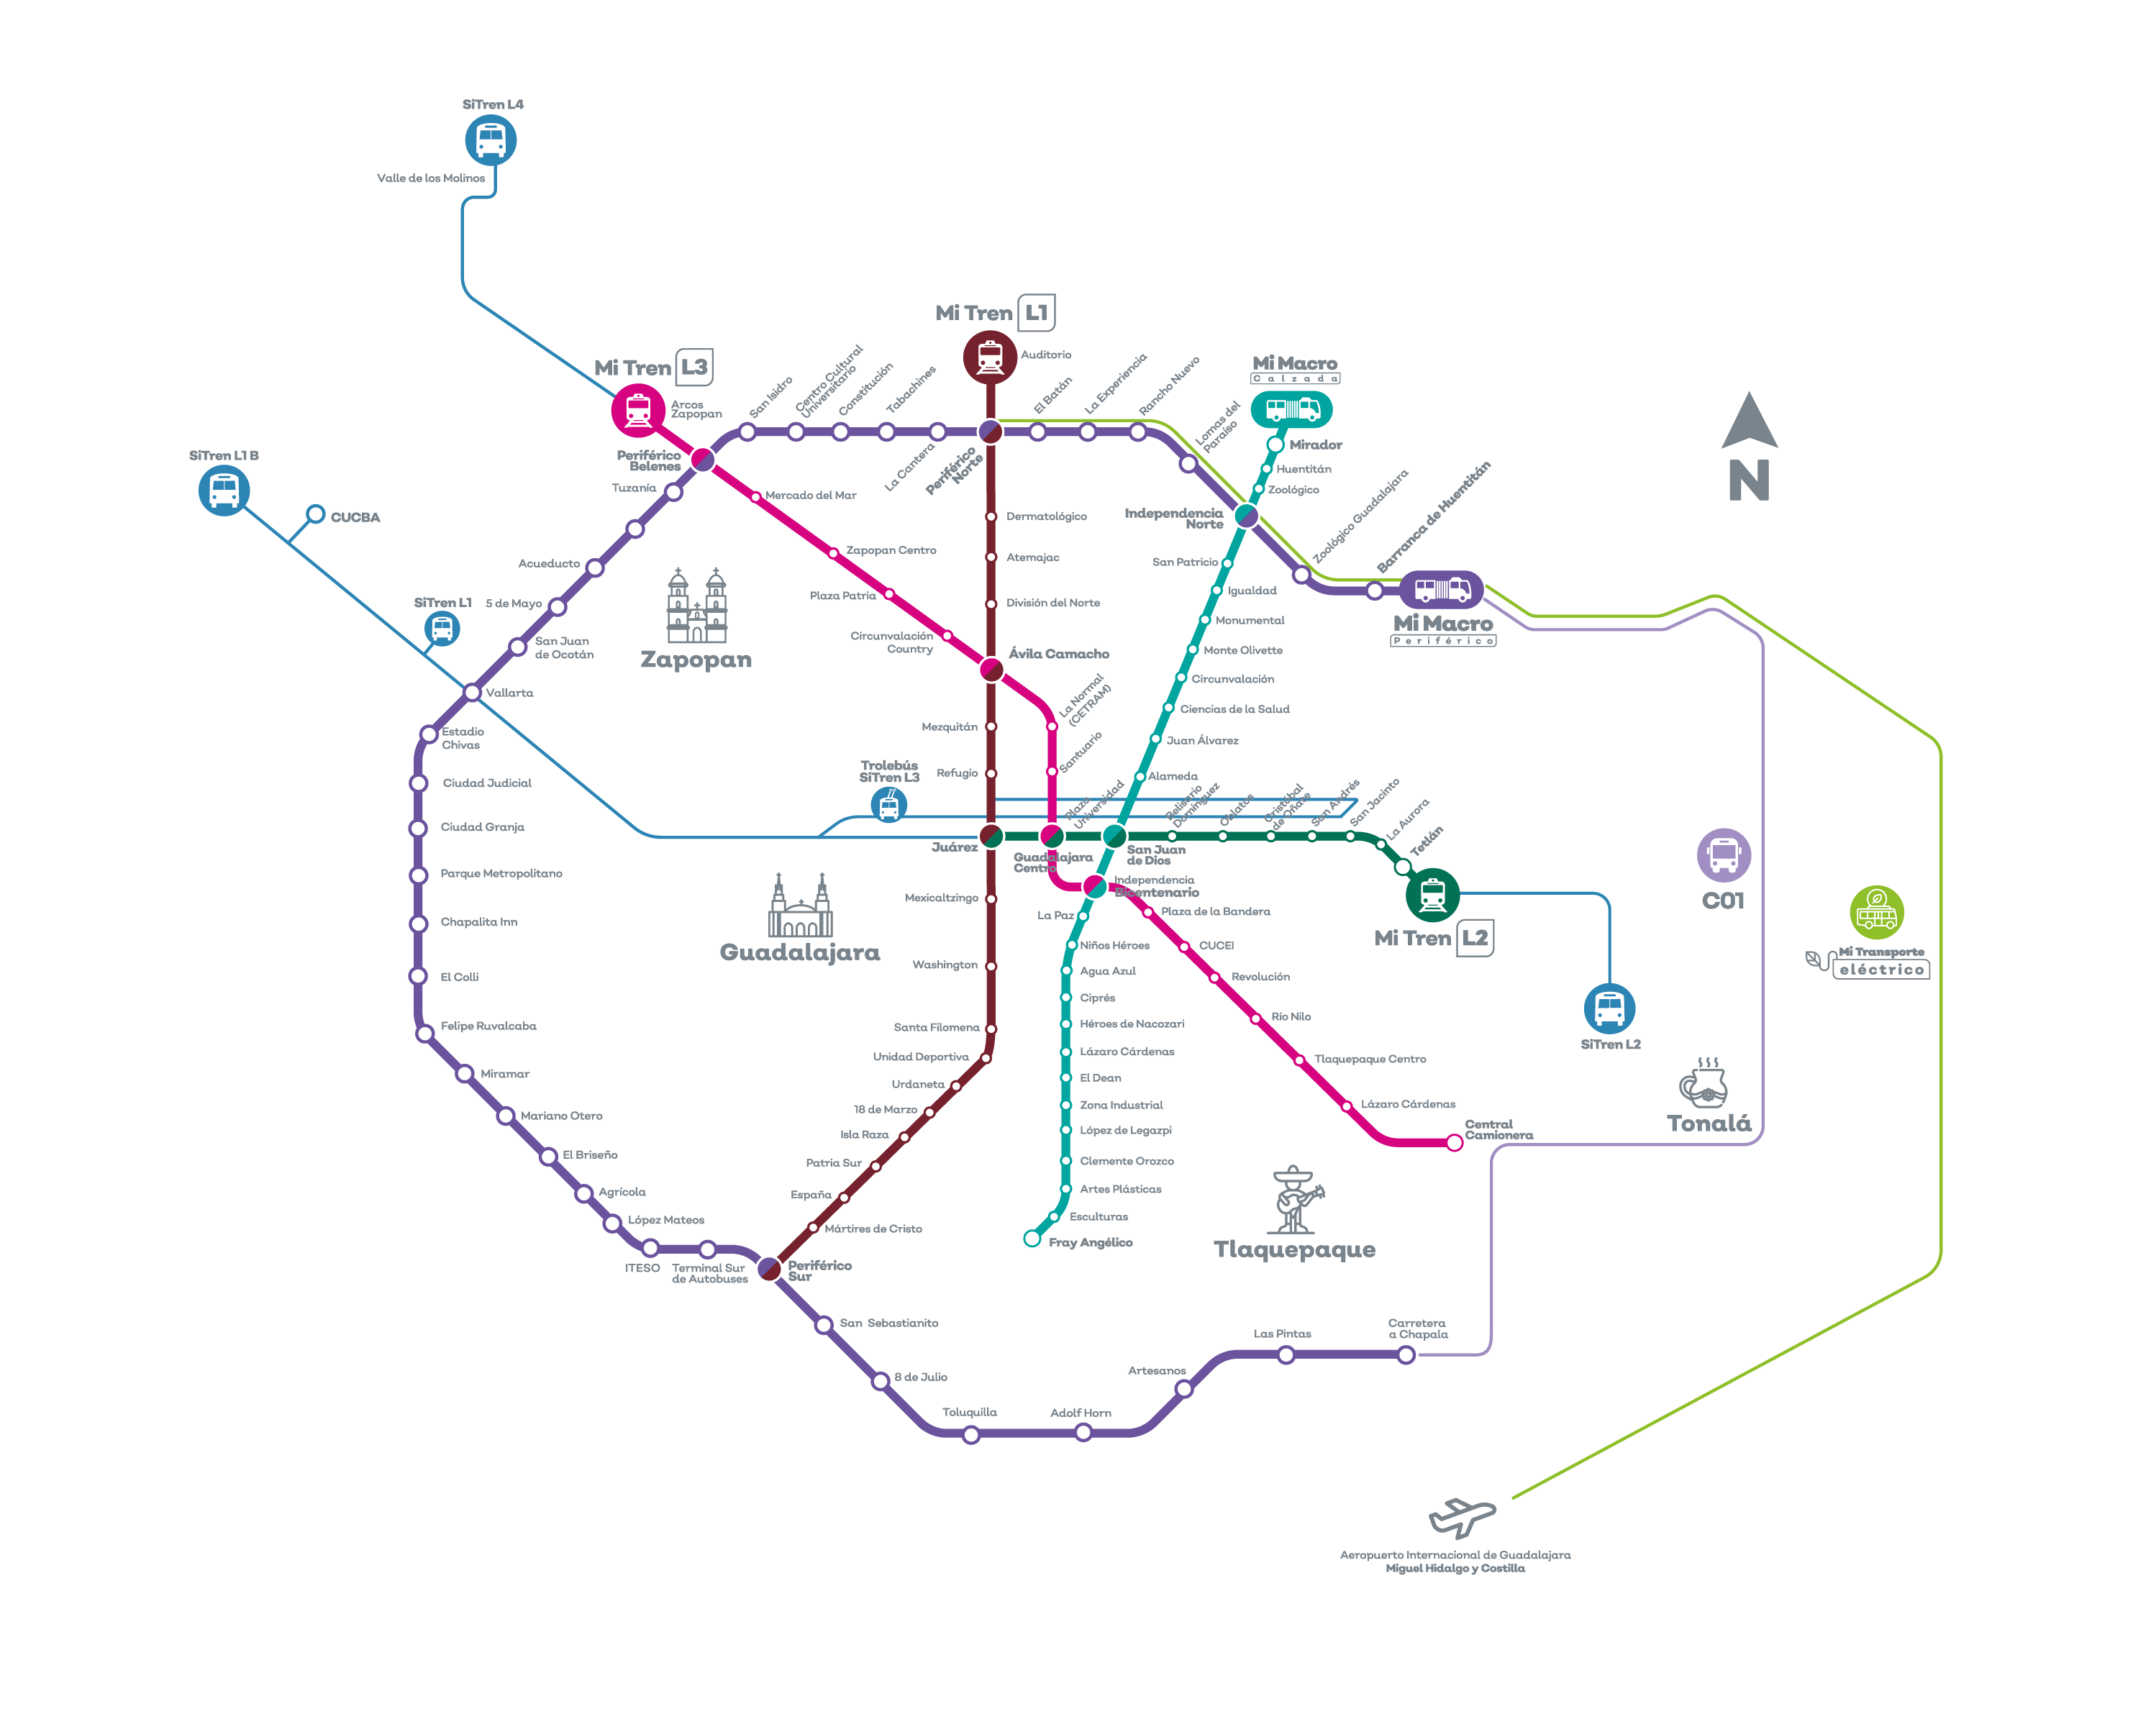 |
|---|
| Public transport in Guadalajara’s Metropolitan Zone provided by SITEUR |
Removing multiple instances
As mentioned previously, working with polygon shapes, means that complex buildings structures might include more than one shape to be represented. This means that, like in the image below, a building can appear twice or more in our dataframe without the same coordinates or form.
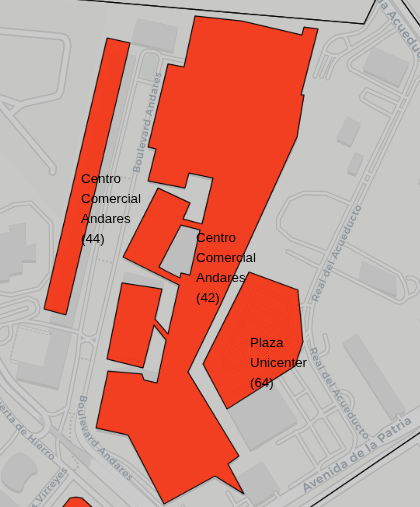
To get around these cases, a new “area” column was created and only the biggest structure was left in the final data. Going back to the example above, “Centro Comercial Andares” had two buildings and only the one at the right was kept since it was the largest.
Green spaces classification
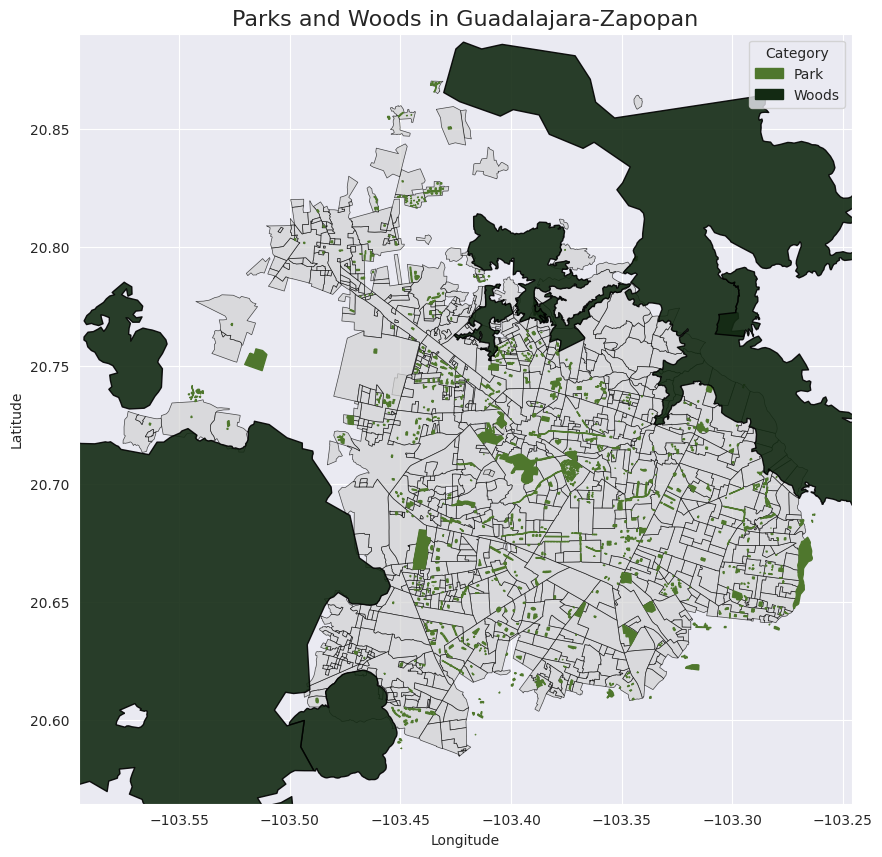
Green spaces in Guadalajara and Zapopan are categorized between parks, forests, and gardens by the API. That classfication is correct, nevertheless, for the model we need to get all the green spaces inside the city into a single category and the bigger areas outside in the city borders as forests or natural protected areas.
Similar to the approach above, a new area column was created and used to classify all the green spaces below 2.5 km² (most of the green spaces in the city) as parks and woods anything above that. As we can see in the image below, now there is a distinction between the green areas in the city and large forests in the surroundings.
Final result
The final result is a clean table with the following columns:
| Column | Description |
|---|---|
| category | Broader category (ex. hospital) |
| subcategory | Granular categorization (ex. private/public hospital) |
| name | Venue name (ex. Oxxo, Metropolitan park, Andares mall) |
| operator | Where it applies, the administrator (ex. SITEUR, government, private, etc.) |
| geometry | Coordinates or polygon for a venue |
| source | API from where the data was gotten from |
Data exploration
References
[1] Chica-Olmo, J., Cano-Guervos, R., María-Despoina Moschovaki, & Tamires-Turizo, I. (2021). What is the effect of location on rental housing prices in Athens? Review of Business Management, 23(3), 439–453. https://doi.org/10.7819/rbgn.v23i3.4114
[2] Cireddu, A. (2021). New Housing Developments in the City Center of Guadalajara (Mexico): An Analysis from the Perspective of Collective and Sustainable Dwelling. Buildings, 11(4), 168–168. https://doi.org/10.3390/buildings11040168